Although the role of deep-sea corals in supporting biodiversity is well accepted, their ability to recover from anthropogenic impacts is still poorly understood. An important component of recovery is the capacity of corals to grow back after damage. Here we used data collected as part of an image-based long-term monitoring program that started in the aftermath of the Deepwater Horizon oil spill to develop a non-destructive method to measure in situ growth rates of Paramuricea spp. corals and characterize the impact of the spill on growth. About 200 individual coral colonies were imaged every year between 2011 and 2017 at five sites (three that were impacted by the spill and two that were not). Images were then used to test different methods for measuring growth. The most effective method was employed to estimate baseline growth rates, characterize growth patterns, estimate the age of every colony, and determine the effects of impact and coral size on growth. Overall growth rates were variable but low, with average annual growth rates per site ranging from 0.14 to 2.5 cm/year/colony. Based on coral size and growth rates, some colonies are estimated to be over two thousand years old. While coral size did not have an influence on growth, the initial level of total impact in 2011 had a significant positive effect on the proportion of new growth after 2014. However, growth was not sufficient to compensate for branch loss at one of the impacted sites where corals are expected to take an average of 50 years to grow back to their original size. The non-destructive method we developed could be used to estimate the in situ growth rates on any planar octocoral, and would be particularly useful to follow the recovery of corals after impact or assess the effectiveness of Marine Protected Areas.
Introduction
Deep-sea corals are ubiquitous; they are found at all latitudes and are common at depths between 200 and 1000 m (Watling et al., 2011; Buhl-Mortensen et al., 2014). Octocorals, in particular, occur across a wide range of depths, including as deep as 6000 m (Grasshoff, 1981). Deep-sea octocorals can form dense aggregations that harbor a high diversity and density of organisms (Krieger and Wing, 2002; Mortensen and Buhl-Mortensen, 2005; Buhl-Mortensen et al., 2010; De Clippele et al., 2015). Because they can live for hundreds to thousands of years (Risk et al., 2002; Roark et al., 2009; Prouty et al., 2014), corals sustain stable and long-lasting ecosystems in the deep ocean.
Deep-sea benthic communities are generally characterized by low metabolic and turnover rates (Childress, 1995; Seibel and Drazen, 2007). Deep-living octocorals also have long reproductive cycles and low recruitment rates. Gamete development and oocyte maturation in the octocoral species Ainigmaptilon antarcticum can take more than a year (Orejas et al., 2002), and low number of recruits and high recruit mortality have been recorded for Paragorgia arborea and Primnoa resedaeformis, respectively (Lacharité and Metaxas, 2013). Given the low recruitment rates, the recovery of damaged deep-water octocoral communities depends largely on the survivorship of individual coral colonies (Doughty et al., 2013). Therefore, information on the longevity and growth rates of individual colonies is essential in order to assess the potential for deep-sea corals to recover after natural or anthropogenic impacts. With the increasing number of threats to deep-water coral ecosystems resulting from human activities such as fishing (Koslow et al., 2001; Fosså et al., 2002; Hall-Spencer et al., 2002; Clark and Koslow, 2008), mining (Van Dover et al., 2017), oil extraction (White et al., 2012; Cordes et al., 2016), and climate change (Chen et al., 2017; Schmidtko et al., 2017), the need to understand their resilience and better inform conservation decisions has become acute.
Counting annual growth rings in association with radiocarbon dating is the most commonly used method to estimate the age and growth rates of deep-sea octocorals. 14C-based ages have been estimated for many octocorals: Coraliidae (Roark et al., 2006), Isididae (Sherwood and Edinger, 2009; Thresher, 2009), Paragorgiidae (Sherwood and Edinger, 2009), Plexauridae (Sherwood and Edinger, 2009; Prouty et al., 2014) and Primnoidae (Sherwood et al., 2005; Sherwood and Edinger, 2009; Martinez-Dios et al., 2016). Although radiocarbon methods are suitable for time periods as far back as 40,000 years, their accuracy is limited by calibration issues (Robinson et al., 2014). As an alternative, analyses based on the isotope 210Pb have been used in several studies of Isididae (Tracey et al., 2007) and Primnoidae (Andrews et al., 2002; Martinez-Dios et al., 2016). 210Pb dating provides a more reliable measure of growth rates and coral ages up to about 100 years (Robinson et al., 2014). A few other methods, such as counting rings without radiometric analyses (Mortensen and Buhl-Mortensen, 2005), amino acid racemization dating (Goodfriend, 1997; Sherwood et al., 2006), staining methods (Marschal et al., 2004), and aquaria growth experiments (Cordes et al., 2001), have been developed but are not commonly used for deep-living octocoral species. Although these methods have contributed significantly to our knowledge of the growth rates and longevity of deep-sea corals, they all share the disadvantage of requiring the collection of entire, and often very old, coral colonies.
Non-destructive methods to measure growth rates have been developed for shallow-water octocorals with a planar morphology. In several studies, the linear growth of individual branches was measured from images of coral colonies that were, in some instances, compressed between sheets of clear acrylic glass to align branches and photographed against a grid (Brazeau and Lasker, 1992; Coma et al., 1998; Lasker et al., 2003; Matsumoto, 2004; Stone et al., 2017). However, due to the technical limitations associated with working in the deep sea, these methods have not been used for deep-sea octocorals. To date, only one study has successfully measured in situ growth rates of deep-sea octocorals using imagery (Bennecke et al., 2016). In this study, growth rates of the octocoral species Paragorgia arborea and Primnoa resedaeformis were estimated from 3D models of seven coral colonies obtained via photogrammetric reconstruction.
Data acquired in the aftermath of the 2010 Deepwater Horizon oil spill provided a unique opportunity to study the growth of deep-sea octocorals in the northern Gulf of Mexico. About 780 million liters of crude oil were released over 87 days at a depth of 1500 m (McNutt et al., 2011). In addition, 7 million liters of dispersant were deployed as a response to the spill both at the surface and at depth. Both the oil and dispersant reached the seafloor via a large deep-water plume that originated from the source (Camilli et al., 2010) and in the form of oil and dispersant contaminated marine snow that rained down from the surface (Passow et al., 2012; Passow, 2014; Passow et al., 2017). Three months after the well was capped, an impacted coral community dominated by the octocoral Paramuricea biscaya (Grasshoff, 1977) was discovered in the US Bureau of Ocean Energy Management (BOEM) lease block Mississippi Canyon [MC] 294, 11 km from the well at a depth of 1370 m (White et al., 2012). Two additional impacted coral communities were discovered in 2011 in lease blocks MC297 and MC344 at depths of 1560 and 1850 m, 9 and 22 km from the well, respectively (Fisher et al., 2014b). Coral communities at both of these sites were also dominated by P. biscaya.
An image-based long-term monitoring program was initiated at MC294 in 2010 to assess the recovery of corals impacted by the oil spill (Hsing et al., 2013; Fisher et al., 2014a). Several coral communities, including the other two impacted communities (MC297 and MC344) and a non-impacted, reference community dominated by Paramuricea sp. B3 (Doughty et al., 2013) (Atwater valley [AT] 357), were added to the program in 2011 (Fisher et al., 2014b). Additionally, a second reference community (at Green Canyon [GC] 852), dominated by P. biscaya, was included in the program in 2016 (Girard and Fisher, 2018). Early results showed that the median level of impact at MC294 decreased between 2010 and 2012, but that several colonies were still heavily impacted in 2012 (Hsing et al., 2013). Overall, recovery was slow and depended on the initial level of impact, with the most heavily impacted colonies expected to take up to 30 years to reach a state where they would appear completely healthy (Hsing et al., 2013; Girard and Fisher, 2018; Girard et al., 2018). Moreover, branch loss was still abnormally high seven years after the oil spill, indicating an ongoing effect of the spill on corals (Girard and Fisher, 2018). Recovery was influenced by the presence of the ophiuroid associate Asteroschema clavigerum, which facilitated the recovery of impacted corals, likely by removing particles deposited on branches and preventing the settlement of hydroids (Girard et al., 2016).
In this study, we used images collected annually between 2011 and 2017 from three sites that had been impacted by the Deepwater Horizon spill (MC294, MC297 and MC344). In addition, we collected images from one reference site annually between 2011 and 2016 (AT357) and from another in 2016 and 2017 (GC852). The images were used to: 1) develop and test non-destructive methods for measuring growth rates of Paramuricea biscaya and P. sp. B3, 2) use the optimal method to determine in situ growth rates of visibly healthy coral colonies (baseline growth rates) at each site, and 3) assess whether the oil spill affected the subsequent growth of impacted corals at the two sites that were the most heavily impacted by the spill (MC294 and MC297).
Materials and methods
Study sites
Individual coral colonies were imaged between 2011 and 2017 at five sites in the northern Gulf of Mexico (Figure 1). Impact from the Deepwater Horizon oil spill was detected at three of these sites (MC294, MC297 and MC344; Fisher et al., 2014b). The MC294 site was located on the west flank near the top of a salt dome (Biloxi Dome) at a depth of 1370 m. Corals at this site were found predominantly on two adjacent carbonate slabs in a 10 × 12 m area (White et al., 2012). The site in lease block MC297 was also located on the west flank on a different salt dome (Georgia Dome) at a little greater depth of 1560 m. Corals at this site were found in two areas (20 × 50 m and 25 × 15 m) separated by a distance of 360 m, each with numerous coral colonies growing on scattered carbonate outcrops. Coral colonies in the MC344 lease block were found near the ridge on the west flank on the much smaller Dauphin salt dome at 1850 m depth. Corals at this site were spread out on scattered small outcrops over a 56 × 66 m area, with several relatively isolated coral colonies within this area.
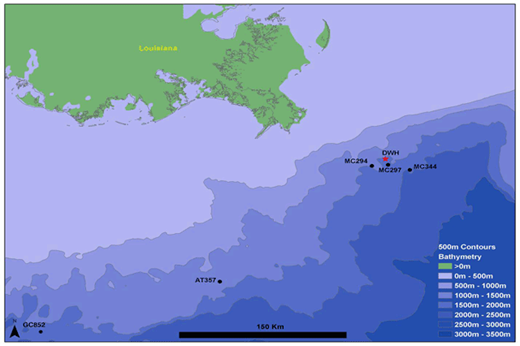
Map of the northern Gulf of Mexico showing the location of the five monitoring sites. The location of the Deepwater Horizon spill site is indicated by a red star. AT357 and GC852 indicate reference sites; MC294, MC297 and MC344 indicate impacted sites. DOI: https://doi.org/10.1525/elementa.349.f1
Map of the northern Gulf of Mexico showing the location of the five monitoring sites. The location of the Deepwater Horizon spill site is indicated by a red star. AT357 and GC852 indicate reference sites; MC294, MC297 and MC344 indicate impacted sites. DOI: https://doi.org/10.1525/elementa.349.f1
There was no visual evidence of recent impact at the other two sites (GC852 and AT357, located 325 and 183 km, respectively, away from the Macondo well). Corals in lease block GC852 (1400 m depth) were found on a ridge in an area with consistent 1–2 knot currents during each visit. The coral communities studied at this site were on large boulders and carbonate outcrops localized within a 31 × 80 m area. The site in lease block AT357 was on a local topographic high, but was the shallowest site used in this study (1050 m). This site hosted a much larger coral community than any of the other four sites. Unlike at the other sites where all coral colonies were imaged, AT357 corals were chosen opportunistically (areas where the ROV could land and work) in an area of about 190 × 115 m. At AT357 coral colonies were generally found on outcropping carbonate slabs, platforms, and crusts. In addition to the Paramuricea sp. found at this site, Madrepora sp. were also abundant.
MC294, MC297, MC344 and GC852 were dominated by the plexaurid octocoral Paramuricea biscaya. AT357 was dominated by a closely-related species, Paramuricea sp. B3, the Paramuricea species most common at that depth.
Data collection
Although the three impacted sites in Mississippi Canyon were monitored annually between 2011 and 2017, corals at AT357 were not monitored in 2017 because of logistical/weather constraints (Table 1). Because image quality was generally poor in 2013, images from that year were not used in this study. Moreover, corals in GC852 were only imaged in 2016 and 2017. Although the corals in MC294 were also imaged in 2010 (White et al., 2012), these images were not used for this study as image resolution was suboptimal for growth measurements and, because corals were still covered in floc at that time, branches were often not clearly visible.
Number of images used each year to measure growth and total size at the different sites. DOI: https://doi.org/10.1525/elementa.349.t1
| Purpose | Site | Paramuricea species | Number of images for growth analyses | Number for total size | Number for height | ||||||
|---|---|---|---|---|---|---|---|---|---|---|---|
| 2011 | 2012 | 2013 | 2014 | 2015 | 2016 | 2017 | 2014 | 2014 | |||
| Methods test | MC294 (Method 1) | P. biscaya | 21 | 21*a | 0 | 21* | 21* | 21* | 21* | 38* | NAc |
| MC294 (Method 2) | P. biscaya | 21 | 21 | 0 | 21 | 21 | 21 | 21* | 38* | NA | |
| Growth analyses | AT357 | P. sp. B3 | 20 | 20 | 0 | 20 | 20 | 20* | 0 | 75* | 59* |
| GC852 | P. biscaya | 0b | 0b | 0b | 0b | 0b | 63b | 63*b | 0 | 0 | |
| MC294 | P. biscaya | 25 | 25 | 0 | 25 | 25 | 25 | 25* | 38* | 33* | |
| 0b | 0b | 0b | 0b | 0b | 32b | 32*b | |||||
| MC297 | P. biscaya | 50 | 50 | 0 | 50 | 50 | 50 | 50* | 66* | 55* | |
| 0b | 0b | 0b | 0b | 0b | 55b | 55*b | |||||
| MC344 | P. biscaya | 22 | 22 | 0 | 22 | 22 | 22 | 22* | 66* | 53* | |
| 0b | 0b | 0b | 0b | 0b | 60b | 60*b | |||||
a An asterisk indicates images that were digitized (the other images were used to identify growth which was subsequently digitized on images identified with an asterisk).
b Images used to compare growth rates between reference site GC852 and impacted sites MC294, MC297 and MC344. A larger number of images were used for the 2016–2017 independent comparisons, as coral colonies discovered after 2012 could be included in that dataset.
c Not applicable.
High-definition photographs of each individual coral colony were obtained using a digital still camera held in the manipulator arm of a Remotely Operated Vehicle (ROV). On each visit, the same headings and camera settings were used to facilitate comparisons between years. The distance between the camera and the colonies varied somewhat between years but framing the images similarly using zoom functions on the cameras largely compensated for this issue. Both Paramuricea biscaya and P. sp. B3 have a planar morphology and all branches were thus generally visible in the same image, or mosaic of images taken from the same heading.
Impact and branch loss quantification
The 2011 (or 2016 for GC852) images of each individual coral colony were digitized using Inkscape 0.48.5. Branches were coded based on four categories depending on their state: healthy, unhealthy (excess mucous or exposed skeleton), colonized by hydroids, or unclassified (branch obscured or insufficient image quality) as described in Hsing et al., (2013) and Girard and Fisher (2018). For the analyses of coral condition over time, the digitized 2011 image was used as a template and branches were re-coded each year based on their new state. After 2011, a new coding category was added for branches that broke off between consecutive years (Girard and Fisher, 2018). The level of total visible impact (sum of the proportions of unhealthy and hydroid-colonized branches) each year, as well as the number of branches that broke between consecutive years, were quantified.
Coral size measurements
The size of each coral colony was estimated in 2014 using a resilient perforated plastic ball (“wiffle ball”) with a diameter of 8.9 cm as reference. The ball was mounted on a pole held by the ROV manipulator arm and was positioned next to, and in contact with, the colony and imaged in the same plane. Images were then digitized and the total cumulative length of all coral branches (total size) was calculated (Figure 2). Size was estimated for 170 Paramuricea biscaya colonies (38 at MC294, 66 at MC297, 66 at MC344) and 75 Paramuricea sp. B3 colonies (at AT357) in 2014 (Table 1). Size was adjusted for the other years by adding (before 2014) or removing (after 2014) branches that broke off. The total number of internodes (segments that separate two branches) and terminal branches in 2011 (or 2016 at GC852) were counted on each coral colony using the Cell Counter tool in ImageJ 1.48, and used as a proxy for the total number of branches. As for size, this number was adjusted the following years by removing branches that broke off. As coral size could not be directly measured at GC852, a polynomial regression model, including coral size as a response variable and the total number of branches as explanatory variable, was used to predict the size of each coral colony at GC852 based on their total number of branches (Figure S1). Data collected on P. biscaya colonies at MC294, MC297 and MC344 were used for this regression model.
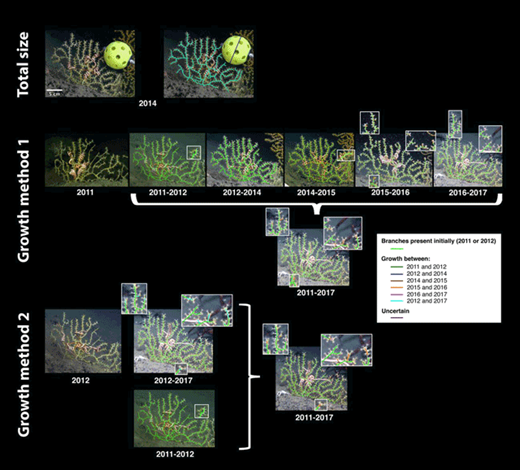
Total size and growth measurement methods for a Paramuricea biscaya colony. This colony was photographed at site MC294 at a depth of 1370 m. Total size was measured using the images from 2014, when the ball used as a size reference was placed next to the corals and photographed. In Method 1, growth was first measured between consecutive years (2013 images were not used due to insufficient image resolution). Once the images from 2012, 2014, 2015, 2016, and 2017 were digitized with the new growth over the previous time period, each increment of growth was digitized on the 2017 image. In Method 2, growth was measured directly by comparing the 2012 and 2017 images and digitized on the 2017 image. The 2017 digitized image was then compared to images from the previous years to identify when growth occurred. To allow for comparison of the methods and use of all data, growth measured between 2011 and 2012 was also added to the 2017 image in Method 2. DOI: https://doi.org/10.1525/elementa.349.f2
Total size and growth measurement methods for a Paramuricea biscaya colony. This colony was photographed at site MC294 at a depth of 1370 m. Total size was measured using the images from 2014, when the ball used as a size reference was placed next to the corals and photographed. In Method 1, growth was first measured between consecutive years (2013 images were not used due to insufficient image resolution). Once the images from 2012, 2014, 2015, 2016, and 2017 were digitized with the new growth over the previous time period, each increment of growth was digitized on the 2017 image. In Method 2, growth was measured directly by comparing the 2012 and 2017 images and digitized on the 2017 image. The 2017 digitized image was then compared to images from the previous years to identify when growth occurred. To allow for comparison of the methods and use of all data, growth measured between 2011 and 2012 was also added to the 2017 image in Method 2. DOI: https://doi.org/10.1525/elementa.349.f2
To allow for comparisons with other studies, the height of each coral colony (distance between the base of the colony and the tip of the longest branch) at MC294, MC297, MC344 and AT357 was measured in ImageJ 1.48 using the scale provided by the ball in the images. Height was not measured for colonies at GC852 (Table 1).
Growth measurements
Linear growth (increase in branch length) was measured on 97 Paramuricea biscaya (25 at MC294, 50 at MC297 and 22 at MC344) between 2011 and 2017 because images of sufficient quality for growth determination were available for these colonies in 2011, 2012, 2014, 2015, 2016 and 2017 (Table 1). Using images from only 2016 and 2017, growth could be measured on 210 colonies of P. biscaya (32 at MC294, 55 at MC297, 60 at MC344, and 63 at GC852) over these years. Linear growth was measured on 20 colonies of Paramuricea sp. B3 at AT357 between 2011 and 2016 (with images of sufficient resolution for all years except 2013). Two types of growth could be detected from the images: branches could either increase in length by adding polyps at their tips or produce a new branch. Since the angle varied slightly from year to year, determining whether a branch grew based only on its apparent length was often not possible. Therefore, the number of polyps on each terminal branch was counted and used as reference to detect/confirm growth. Two growth measurement methods were tested (Figure 2).
Method 1 (measurement between consecutive years). Images were digitized to measure growth between every consecutive year that the corals were imaged, with the exclusion of 2013. Images collected in 2013 were not included in this analysis due to their low resolution, so growth was measured between 2012 and 2014 instead. Each year, coral images were compared to the images from the previous year (or to 2012 in the case of the 2014 images) and digitized into three different categories: branches or parts of branches that were present the previous year, branches or parts of branches that grew over that time period (increased in length or formed a new branch), and branches that could not be measured (e.g. obscured in one of the years). All growth detected from each individual time increment between 2011 and 2017 was digitized onto the 2017 image to estimate total growth over that time period (Figure 2).
Method 2 (direct measurement between 2012 and 2017). Growth was measured directly between 2012 and 2017 using only the images collected in those two years. We chose to measure growth over this slightly reduced time period because many impacted corals were still covered in mucus in 2011, and the camera used that year had a lower resolution than the one used in 2012, decreasing the number of corals that could be included and the accuracy of growth estimates. Growth detected between 2012 and 2017 was digitized on the 2017 image using the same digitization method as for Method 1. To better understand the growth dynamics between 2012 and 2017, images from each additional year (2014, 2015, and 2016) were compared to the digitized 2017 image in order to identify when the detected growth occurred. First, the digitized 2017 image was compared to the 2014 image to identify growth that occurred between 2012 and 2014 (again the 2013 images were excluded). It was then compared to the 2015 and finally to the 2016 images to identify growth that occurred during the following consecutive years. Branches were then re-coded accordingly to indicate when growth had occurred (Figure 2). In order to have a measure of growth rates over the full study period (2011 to 2017), growth detected between 2011 and 2012 with Method 1 was later added to the 2017 digitized image to estimate total growth between 2011 and 2017 using this method (Figure 2).
For both methods, each coral colony was digitized independently by two observers. One complete set of images for both methods was digitized by observer 1. An independent round of digitization was accomplished by two other observers, one who completed a portion of the corals for Method 1 and another who completed the rest of the corals for Method 1 and all for Method 2. The digitized images from both observers were then compared. When both observers detected growth on the same branch, growth was validated. When growth on a branch was only detected by one observer, that particular branch was revisited by the lead author to confirm whether growth had occurred or not. Growth rates were estimated once a consensus was reached. The proportion of new branches (growth proportion), the amount of linear growth (growth proportion*total coral size), and both the number of branches that increased in length and the number of newly-formed branches between every consecutive year or between 2012 and 2017 were then estimated for each coral.
As very few branches grew on each coral colony, all growth rates indicated in this study represent the total amount of growth detected on each colony, and not the average growth per branch as in several other studies (Brazeau and Lasker, 1992; Coma et al., 1998; Lasker et al., 2003; Matsumoto, 2004; Stone et al., 2017).
Methods comparison
Images of 21 coral colonies at MC294 were used to test for differences in growth detection between the two growth measurement methods (Table 1). This site was chosen for several reasons: it was dominated by Paramuricea biscaya, the species the most affected by the spill; corals were monitored throughout the 2011 to 2017 time period; and, of the three Mississippi Canyon sites, preliminary data indicated that corals at this site grew the most. Differences in the average growth proportion measured on MC294 corals with Method 1 and Method 2 were tested with Sign tests. The proportion of branches detected with Method 1 but missed with Method 2 and vice versa were estimated between each consecutive year or between 2011 and 2017 and compared with two-proportion z-tests. For both tests a Bonferroni correction of α = 0.05 was applied to account for multiple comparisons.
Baseline growth and effect of coral size
For this analysis, average growth rates (both as growth proportion and amount of linear growth in centimeters) were estimated at each site using only visibly healthy corals. Corals that were initially impacted to 20% or less of the colony had completely recovered (with respect to appearance) in the year that followed the spill (Hsing et al., 2013), and were thus considered visibly healthy. As observers were more likely to miss growth when using Method 1, Method 2 was employed to determine and compare average annual growth rates at MC294, MC297, MC344 and AT357. Additionally, growth measured between 2016 and 2017 (using Method 1 for this single year increment) was compared between MC294, MC297, MC344 and GC852 (GC852 was monitored for the first time in 2016). Differences in growth rates between sites were tested with non-parametric Kruskal-Wallis tests followed by pairwise Mann-Whitney Wilcoxon tests when significant.
The number of newly-formed branches as well as the number of branches that increased in length were recorded between every consecutive year. Each time, a distinction was made between branches that were produced or had grown in the previous years, and branches that had not grown since 2011. The null hypothesis that all branches had the same likelihood to grow (as those that were produced or had grown in the previous years) was tested with Chi-square tests.
Generalized linear models were used to test the effect of total coral size on growth proportion between 2011 and 2017 at MC294, MC297 and MC344, between 2011 and 2016 at AT357, and between 2016 and 2017 at GC852. The effect of size on the amount of linear growth (in centimeters) was not tested, as it did not follow a normal distribution and no transformation could be applied to approximate a normal distribution due to the large number of zeros in the dataset. A binomial error distribution with a logit link function, commonly used for proportion data with many zeros, was used for all generalized linear models. A quasibinomial instead of binomial distribution was used when overdispersion was detected (the residual deviance was greater than the residual degree of freedom, meaning that the variability in the data was larger than the variability expected under the assumed binomial distribution).
Effect of the Deepwater Horizon oil spill on coral growth and size
Corals from MC294 and MC297 were used to examine the effect of the spill on coral growth. MC344 corals were not included in these analyses, as growth rates at this site were too low, even for apparently healthy corals, to enable detection of potential impact from the spill. Growth rates were only compared among colonies from the same site, as baseline growth rates differed from one site to another. At each site, the average growth (both as growth proportion and amount of linear growth in centimeters) measured between each consecutive year was compared between healthy and significantly impacted corals (total visible impact proportion larger than 20%). For this analysis, only visibly healthy branches were considered in the growth proportion calculations, as no growth was detected on unhealthy or hydroid-colonized branches (absence of live tissue or visible polyps to count).
The effects of the initial level of impact (impact in 2011) or current impact (level of impact at the beginning of each time increment) and coral size on growth proportion were tested with generalized linear mixed models (GLMMs). Again, the amount of linear growth (in centimeters) was not included as a response variable in the GLMMs, as it did not follow any known distribution. Several models were tested based on different fixed effects: first, the initial (2011) total visible impact proportion (IMPini) and coral size (SIZE) were used as fixed effects in the model; then, the current total visible impact proportion (IMP) and coral size were used; and finally, when the level of total visible impact proportion (initial or current) had a significant effect on growth proportion, the proportions of unhealthy (Uini or U) and hydroid-colonized (Hyini or Hy) branches were used as fixed effects. A binomial distribution using a logit link function was used for each model. In all models, sampling year (YEAR) was included as a random effect to account for the fact that the same corals were imaged every year. Individual coral colonies (CORAL) nested within sites (SITE) were also included as random effects to avoid overdispersion. The following models were tested.
Effect of initial impact:
1. Growth proportion ~ IMPini + SIZE + IMPini*SIZE + (1|YEAR) + (1|SITE/CORAL).
If the effect of the initial impact proportion on growth proportion was significant, then:
2. Growth proportion ~ Uini + Hyini + Uini*Hyini + (1|YEAR) + (1|SITE/CORAL).
Effect of current impact:
3. Growth proportion ~ IMP + SIZE + IMP*SIZE + (1|YEAR) + (1|SITE/CORAL).
If the effect of the current impact proportion on growth proportion was significant, then:
4. Growth proportion ~ U + Hy + U*Hy + (1|YEAR) + (1|SITE/CORAL).
When the effect of initial or current impact on growth proportion was significant between 2011 and 2017, additional GLMMs, with individual coral colonies nested within sites included as random effect, were used to test the effect of initial or current impact on growth proportion for every consecutive year separately.
The sizes of each of the individual corals in 2011 and 2017 were calculated at all three impacted sites (MC294, MC297 and MC344) based on sizes estimated in 2014 (as described above), but this time both branch loss and growth were included. The difference between coral size in 2011 and 2017 was then estimated for each colony, and differences between the average size change estimated for healthy and impacted corals at each site were tested with non-parametric Mann-Whitney Wilcoxon tests. Correlations between the difference in coral size between 2011 and 2017 and the initial (2011) level of total visible impact were tested using Spearman’s rank correlation. The time necessary for corals to grow back to their original size (if they do not continue to lose branches) was estimated using the average annual growth rates calculated at each site.
Age estimation
The measured average annual growth rates for each site were used to estimate the age of all corals at a given site based on their total size in 2011 (before impacted corals started to lose significant numbers of branches). Ages were then compared to the ages estimated with radiocarbon dating by Prouty et al., (2014) for Paramuricea biscaya or Paramuricea sp. B3 at the same sites. For comparison, ages were plotted against height (data on total coral size were not available in Prouty et al., 2014). For each site, a linear regression model with coral age as response variable and height as explanatory variable was fitted to the data. When the assumptions of homoscedasticity and normality were not met, a Box-Cox transformation of the response variable was applied.
All statistical analyses were performed in R (R Core Team, 2014). The lme4 (version 1.1-12) package was used to fit GLMMs (Bates et al., 2015).
Results
Methods comparison
The average proportion of new growth between 2011 and 2017 overall, as well as between every consecutive year except for 2016–2017, was significantly higher when growth was measured with Method 2 (growth directly measured between 2012 and 2017) than with Method 1 (growth measured between consecutive years) (Figure S2a). Revisitation of the branches with growth detected using Method 2 but not (by either observer) with Method 1 (and vice versa) confirmed that growth was missed with Method 1 more often than with Method 2 (Figure S2b). Both the proportion of branches that increased in length and the proportion of newly-formed branches detected with Method 2 but missed with Method 1 between every year, except for 2016–2017 in the case of newly-formed branches, were significantly higher than the proportions detected with Method 1 and missed with Method 2 (Figure S2b). Although Method 2 was more efficient at detecting branches that grew, growth rates estimated with both methods followed the same temporal trends (Figure S2).
Coral size and baseline growth
The largest coral colonies were found at AT357, where total coral size (cumulative length of all branches) ranged from 0.090 m to 41 m with a median of 4.4 m. The total size distribution of Paramuricea sp. B3 was positively skewed, with the majority of colonies having a total cumulative branch length less than 11 m (mostly in the size classes between 0 and 12 m) (Figure 3). A similar size range of P. biscaya colonies was observed at MC294 (median: 3.5 m, minimum: 0.027 m, maximum: 14 m), MC297 (median: 2.6 m, minimum: 0.059 m, maximum: 10 m) and GC852 (median: 2.1 m, minimum: 0.010 m, maximum: 6.8 m). However, P. biscaya colonies at MC344 were generally smaller (median: 1.1 m, minimum: 0.021 m, maximum: 8.0 m) (Figure 3). With the exception of the 14 m outlier colony, the size distribution at MC294 was fairly symmetrical. However, the total size distributions at GC852, MC297 and MC344 were all skewed positively with a spike in the 0–1 m size class. At MC344 the majority of colonies were smaller than 4 m.

Total size and height distributions for colonies of Paramuricea sp. B3 and Paramuricea biscaya. Paramuricea sp. B3 colonies were measured at AT357 and Paramuricea biscaya at MC294, MC297, MC344 and GC852. Coral sizes were initially measured using the images from 2014 (with the ball for scale). Sizes before and after that year were calculated by taking into account branch loss and growth. Coral size could not be measured directly at GC852 because of a lack of images with the ball for scale, so total sizes were estimated using a regression model with the number of branches as the explanatory variable (Figure S1). DOI: https://doi.org/10.1525/elementa.349.f3
Total size and height distributions for colonies of Paramuricea sp. B3 and Paramuricea biscaya. Paramuricea sp. B3 colonies were measured at AT357 and Paramuricea biscaya at MC294, MC297, MC344 and GC852. Coral sizes were initially measured using the images from 2014 (with the ball for scale). Sizes before and after that year were calculated by taking into account branch loss and growth. Coral size could not be measured directly at GC852 because of a lack of images with the ball for scale, so total sizes were estimated using a regression model with the number of branches as the explanatory variable (Figure S1). DOI: https://doi.org/10.1525/elementa.349.f3
The height distributions of both Paramuricea sp. B3 and P. biscaya were all unimodal and more or less bell shaped (Figure 3). The heights of P. sp. B3 corals ranged between 4 and 90 cm, with most colonies in the 20–40 cm size class and a low number of colonies <10 cm high. The height of P. biscaya corals at MC294 ranged between 8 and 64 cm. The height distribution was symmetrical, with a peak at 20–30 cm and very few colonies smaller than 10 cm. The distribution of MC297 corals, ranging from 5 to 60 cm, was positively skewed, with most colonies in the 10–30 cm size class and few colonies smaller than 10 cm. Finally, MC344 had a symmetrical distribution that ranged from 2 to 50 cm.
Although some visibly healthy coral colonies did not show any signs of growth between 2011 and 2017, the majority of corals did grow (Table 2). About 80% of Paramuricea sp. B3 at AT357 grew between 2011 and 2016. More than 90% of the visibly healthy Paramuricea biscaya at MC294 grew between 2011 and 2017, and 77 and 61% of visibly healthy P. biscaya grew during the same time period at MC297 and MC344, respectively. Between 2016 and 2017 growth was detected in 55% of the visibly healthy colonies at MC294. However, most colonies did not grow at the other three sites monitored during the final year of this study. New growth was detected in only 35, 13 and 13% of the corals at GC852, MC297 and MC344, respectively, between 2016 and 2017.
Number of apparently healthy and impacted coral colonies that grew between 2011 and 2017 (or 2011 and 2016 for AT357) and between 2016 and 2017, and number of colonies measured for growth during the indicated time periods. DOI: https://doi.org/10.1525/elementa.349.t2
| Site | Paramuricea species | Coral state | 2011–2017 | 2016–2017 | ||||
|---|---|---|---|---|---|---|---|---|
| Number of corals that grew | Number of corals measured | Number of corals that grew | Number of corals measured | |||||
| Reference | GC852 | P. biscaya | Healthy | ND | a | ND | 22 | 63 |
| AT357 | P. sp. B3 | Healthy | 16 | 20 | ND | ND | ||
| Impacted | MC294 | P. biscaya | Healthy | 15 | 16 | 11 | 20 | |
| MC294 | Impactedb | 6 | 9 | 8 | 12 | |||
| MC297 | P. biscaya | Healthy | 26 | 34 | 5 | 38 | ||
| MC297 | Impactedb | 9 | 16 | 1 | 17 | |||
| MC344 | P. biscaya | Healthy | 11 | 18 | 6 | 47 | ||
| MC344 | Impactedb | 0 | 4 | 0 | 13 | |||
a No data.
b Proportion of impacted branches >20% of the colony in 2011.
Of the 21303 branches that were analyzed for growth, only 600 grew at some point between 2011 and 2017 at all sites combined (Table 3). Growth was not distributed homogeneously between branches within colonies. In general, only a few branches grew at all during a single year (on average, between 2 and 4% of the measured branches on a colony increased in length and between 1 and 3% of branches per colony produced new branches each year; Figure 2). New growth was detected most often on branches located at the edge of the colonies. Moreover, newly-formed branches or branches that had grown in the previous years during the 2011–2017 time period were significantly more likely to grow than branches that did not grow in a previous year at MC294 and MC297 but not at MC344 (Chi-square test; p-value < 0.001 for both MC294 and MC297 but 0.776 at MC344).
Average number of branches per colony, total number of branches measured for growth between 2011 and 2017 (MC294, MC297 and MC344), 2011 and 2016 (AT357) or 2016 and 2017 (GC852) and total number of branches that grew during the indicated time periods at all sites. DOI: https://doi.org/10.1525/elementa.349.t3
| Site | Paramuricea species | Average (± SD) number of branches per colony | Number of branches measured | Total number of branches that grew | |
|---|---|---|---|---|---|
| Reference | GC852 | P. biscaya | 136.3 ± 132.7 | 8579 | 60 |
| AT357 | P. sp. B3 | 212.5 ± 136.5 | 2762 | 186 | |
| Impacted | MC294 | P. biscaya | 202.0 ± 137.7 | 2828 | 122 |
| MC297 | P. biscaya | 211.9 ± 194.7 | 5933 | 185 | |
| MC344 | P. biscaya | 66.72 ± 62.71 | 1201 | 47 | |
| Both | All | P. spp | 157.8 ± 148.5 | 21303 | 600 |
Paramuricea sp. B3 at AT357 grew faster than Paramuricea biscaya at any site with an average annual addition of 2.5 (±3.2 SD) cm/year of branch (growth rates ranged between 0 and 9.2 cm/year) (Figure 4a). For P. biscaya, the highest growth rates were detected at MC294 (1.2 (±1.2 SD) cm/year on average; ranging between 0 and 4.2 cm/year), intermediate rates at MC297 (0.79 (±1.1 SD) cm/year on average; ranging between 0 and 4.2 cm/year) and the lowest rates at MC344 (0.14 (±0.24 SD) cm/year on average; ranging between 0 and 1.0 cm/year) (Figure 4a). Overall, growth rates were significantly different between sites (Kruskal-Wallis; p-value = 0.002) due to significantly lower growth rates at MC344 than at all of the other sites (Table S1). Trends were similar when growth was expressed as the proportion of the colony that grew; corals at AT357 grew the most, followed by corals at MC294, MC297 and MC344 (Figure 4b). While growth rates observed at GC852 (0.42 ± 0.94 SD cm on average, ranging between 0 and 5.8 cm) and MC 294 (0.32 ± 0.55 SD cm on average, ranging between 0 and 1.9 cm) between 2016 and 2017 were similar, less growth was detected at MC297 (0.050 ± 0.30 SD cm on average, ranging between 0 and 0.96 cm) and MC344 (0.015 ± 0.057 SD cm on average, ranging between 0 and 0.26 cm) (Figure 4). Similarly, differences in the amount of linear growth (centimeter) between sites were significant (Kruskal-Wallis, p-value = 0.002), this time due to corals at MC297 and MC344 growing less than at GC852 and MC294 between 2016 and 2017 (Table S1).

Growth of apparently healthy Paramuricea sp. B3 and Paramuricea biscaya colonies. Paramuricea sp. B3 colonies were measured at AT357 and Paramuricea biscaya at MC294, MC297, MC344 and GC852. Average (± SE) annual growth rates (cm) (a) and growth proportions (b) measured with Method 2 (measurement between 2012 and 2017 for sites other than AT357, and between 2012 and 2016 for AT357 in left panel; measurement between 2016 and 2017 in right panel) are presented. Reference sites (AT357 and GC852) are labeled in grey. DOI: https://doi.org/10.1525/elementa.349.f4
Growth of apparently healthy Paramuricea sp. B3 and Paramuricea biscaya colonies. Paramuricea sp. B3 colonies were measured at AT357 and Paramuricea biscaya at MC294, MC297, MC344 and GC852. Average (± SE) annual growth rates (cm) (a) and growth proportions (b) measured with Method 2 (measurement between 2012 and 2017 for sites other than AT357, and between 2012 and 2016 for AT357 in left panel; measurement between 2016 and 2017 in right panel) are presented. Reference sites (AT357 and GC852) are labeled in grey. DOI: https://doi.org/10.1525/elementa.349.f4
With the exception of GC852, no significant effect of colony size on growth proportion was detected at any site between 2012 and 2016 or between 2012 and 2017 (Table S2).
Effect of the Deepwater Horizon oil spill on coral growth
Growth was detected in 56% of visibly impacted corals (visible impact to 20% or more of the colony) at MC294 and 67% of these corals at MC297 (Table 2). However, none of the impacted colonies at MC344 grew detectably between 2011 and 2017 or between 2016 and 2017.
Neither coral size nor the interaction between size and impact (initial or current) had a significant effect on growth proportion, and thus were not included in the final models. The initial level of total visible impact (2011) had a significant positive effect on the proportion of branches that grew between 2011 and 2017 at both MC294 and MC297 (Table S3). Post-hoc pairwise tests revealed that the initial impact proportion had a non-significant negative effect on growth proportion for the periods 2011–2012 and 2012–2014 and a significant positive effect between all following consecutive years (Table S4, Figure 5b). However, the current level of total visible impact (level at the beginning of any of the shorter time increments) did not have a significant effect on growth proportion (Table S3). Models testing separately the effects of the initial proportions of unhealthy and hydroid-colonized branches showed that the proportion of unhealthy branches had a significant positive effect on growth proportion, while the proportion of hydroid-colonized branches had a non-significant negative effect (Table S3).

Comparison of growth rates between healthy and impacted corals. Data were obtained from two sites: MC294 (left panel) and MC297 (right panel). (a) Average (± SE) growth rates (cm) and (b) average (± SE) proportions of healthy branches that grew between 2011 and 2017 are presented. DOI: https://doi.org/10.1525/elementa.349.f5
Comparison of growth rates between healthy and impacted corals. Data were obtained from two sites: MC294 (left panel) and MC297 (right panel). (a) Average (± SE) growth rates (cm) and (b) average (± SE) proportions of healthy branches that grew between 2011 and 2017 are presented. DOI: https://doi.org/10.1525/elementa.349.f5
Similar trends were observed for the amount of linear growth (centimeters) measured at MC297 between 2011 and 2017 (Figure 5a). Impacted corals at this site appeared to grow more than healthy corals between every consecutive year after 2014. A different trend was observed at MC294, where healthy corals grew more on average than impacted corals between every consecutive year except between 2016 and 2017 (Figure 5a).
Effect of the oil spill on changes in coral size
Differences in coral size between 2011 and 2017 at MC294 were significantly greater for impacted corals than for healthy corals (Mann-Whitney Wilcoxon, p-value = 0.001; Figure 6). These differences were significantly negatively correlated with the initial level of total visible impact (Spearman’s rho correlation, rho = –0.737, p-value < 0.001). Based on measured average growth rates, corals that lost branches at this site are expected to take 56 years on average to grow back to their initial size. Some colonies will take up to 291 years to regrow to their initial, pre-impact size. These trends were not observed at MC297 or MC344. At these sites, no difference in changes in size was detected between healthy and impacted corals (Mann-Whitney Wilcoxon, p-value = 0.528 at MC297), and the initial level of total visible impact was not significantly correlated with changes in coral size between 2011 and 2017 (Spearman’s rho correlation, MC297: rho = –0.226, p-value = 0.229, MC344: rho = 0.303, p-value = 0.315).
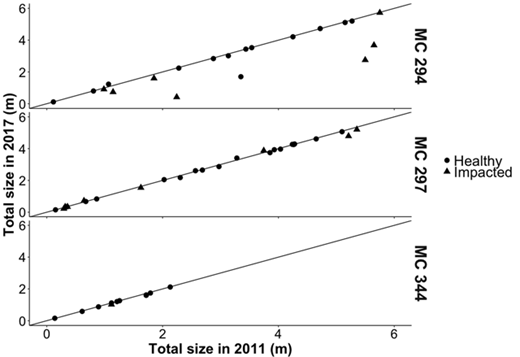
Changes in size between 2011 and 2017 for healthy and impacted Paramuricea biscaya corals. Total size in 2017 is presented as a function of total size in 2011 for both visibly healthy and impacted corals at MC294, MC297 and MC344. Impacted corals are those with visible impact to >20% of the colony in 2011. DOI: https://doi.org/10.1525/elementa.349.f6
Changes in size between 2011 and 2017 for healthy and impacted Paramuricea biscaya corals. Total size in 2017 is presented as a function of total size in 2011 for both visibly healthy and impacted corals at MC294, MC297 and MC344. Impacted corals are those with visible impact to >20% of the colony in 2011. DOI: https://doi.org/10.1525/elementa.349.f6
Age estimations
Ages estimated by Prouty et al., (2014) based on radiocarbon dating fell within the range of ages estimated in this study for corals of similar height at the same sites (Figure 7). Overall, coral colonies at AT357 and MC294 were younger than at MC297 and MC344. Based on the linear regression models, large (value corresponding to the 90th percentile of the height distribution) Paramuricea sp. B3 (height of 60 cm) at AT357 were predicted to be as old as 691 years, while large Paramuricea biscaya colonies at MC294 (53 cm), MC297 (43 cm) and MC344 (36 cm) were predicted to be 695, 876 and 2334 years old, respectively (Figure 7).

Estimated ages of Paramuricea biscaya and Paramuricea sp. B3 as a function of colony height. Data were obtained for Paramuricea sp. B3 at AT357 and Paramuricea biscaya at MC294, MC297 and MC344 using growth rates from image-based analysis (this study, open symbols) and radiocarbon decay (Prouty et al. 2014, solid symbols). Linear regression models were fitted to the data and the estimated means, their corresponding standard errors, and the equations used in the models are shown. DOI: https://doi.org/10.1525/elementa.349.f7
Estimated ages of Paramuricea biscaya and Paramuricea sp. B3 as a function of colony height. Data were obtained for Paramuricea sp. B3 at AT357 and Paramuricea biscaya at MC294, MC297 and MC344 using growth rates from image-based analysis (this study, open symbols) and radiocarbon decay (Prouty et al. 2014, solid symbols). Linear regression models were fitted to the data and the estimated means, their corresponding standard errors, and the equations used in the models are shown. DOI: https://doi.org/10.1525/elementa.349.f7
Discussion
Using image analysis, a non-destructive method, we successfully measured the size and in situ growth rates of about 200 Paramuricea spp. colonies in the northern Gulf of Mexico. The size ranges and distributions measured in this study were similar to those measured previously for the same Paramuricea species at the same sites using a video survey approach (Doughty et al., 2013). Paramuricea sp. B3 colonies at AT357 were generally larger than Paramuricea biscaya at the Mississippi Canyon sites. Except for MC344, all size distributions were characterized by a small number of colonies smaller than 10 cm.
Low numbers of small, non-reproductive, colonies have also been observed for shallow-water Paramuricea clavata in the Mediterranean (Linares et al., 2008), and suggest low recruitment rates. Using a modeling approach, Doughty et al., (2013) predicted that recruitment rates averaged about five individuals per site per year for Paramuricea sp. B3 and ten individuals per site per year for Paramuricea biscaya. Although very small P. biscaya were rare at all sites, small size classes of P. biscaya (10–30 cm) dominated at MC294 and MC297 (Figure 3), a pattern commonly observed in other Paramuricea species (Linares et al., 2008) or other shallow-water octocorals (Yoshioka, 1994; Tsounis et al., 2006). The smaller number of large colonies at our sites could be a result of the slow growth rates of these corals. The even slower growth rates measured and very old ages estimated for P. biscaya at MC344 may explain the relatively larger number of colonies <10 cm and the small number of colonies >40 cm. Together these data suggest that growth of these corals may have reached an asymptote at a much smaller size in this potentially sub-optimal environment for corals than at the other sites.
Growth rates were low compared to other studies, ranging from an average total linear growth (of all branches) of 0.14 (±0.24 SD) cm/year per colony for Paramuricea biscaya colonies at MC344 to 2.5 (±3.2 SD) cm/year for Paramuricea sp B3 at AT357. Image-based studies of shallow-water octocorals have found substantially higher growth rates, up to an average of 2 cm/year per individual branch (Brazeau and Lasker, 1992; Coma et al., 1998; Lasker et al., 2003; Matsumoto, 2004; Stone et al., 2017). Coma et al., (1998) reported that the average growth rate of Paramuricea clavata in the Mediterranean varied between 0.5 and 0.8 cm/year per branch depending on their size, which translated to an average increase of 1.8 cm in colony height every year. In the deep sea, linear extension has only been measured for Primnoa resedaeformis and Paragorgia arborea colonies at a depth of 863 m in the Northeast Channel Coral Conservation Area, where growth rates (increase in colony length) ranged between 1.8 and 2.2 cm/year and between 2.2 and 4.0 cm/year, respectively (Bennecke et al., 2016). These rates are also higher than what we report here for deeper living Paramuricea spp. The higher growth rates estimated in that study could be due, in part, to differences in surface productivity. The Northeast Channel Coral Conservation Area is located at the entrance to the Gulf of Maine, a highly productive region, while the Gulf of Mexico is generally considered to show low productivity, especially offshore.
Growth rates were extremely variable between coral colonies within the same site, but also within colonies, with only a few branches growing each year. High variability in growth rates and unevenness in growth distribution have been observed for several octocoral species (Coma et al., 1998; Castanaro and Lasker, 2003; Matsumoto, 2004). The main factor proposed to explain variability between colonies is coral size (generally represented as colony height). A decrease in growth rates with size has been reported in different studies, probably due to the reallocation of energy toward reproduction or radial growth to increase thickness in the stem and branches as colonies get larger (Grigg, 1974; Coma et al., 1998; Lasker et al., 2003). However, we did not observe any effect of size on coral growth in our study, with the exception of colonies at GC852 when growth was expressed as the proportion of the colony that grew. Other factors influencing growth could have contributed to the observed differences between colonies. Near-bottom water flows have been shown to affect the growth of individual colonies (Sebens, 1984). Corals are suspension feeders that rely on currents to deliver their food. Within sites, coral colonies had different orientations and grew on boulders of varying sizes and shapes. Moreover, with the exception of MC294, corals were dispersed over large areas. Therefore, some colonies were likely exposed to more favorable currents than others. Differences in growth rates could also be due to genotype-specific differences (Rinkevich, 2002).
Within the same colony, individual branches can grow at different rates depending on their position, age and type (e.g., branches that ramify versus terminal branches). Corals are modular organisms; colonies are formed of replicated modules – polyps – that can function independently even if they are interconnected (Sánchez and Lasker, 2003). Therefore, individual branches are likely to grow at different rates depending on their exposure to resources delivered by currents (Kim and Lasker, 1998). We observed that branches that were produced or increased in size during our initial study period were more likely to grow subsequently than branches for which we had not previously detected growth. This observation is consistent with previous findings for several coral species, where “young” branches had higher rates of extension than older branches for a few years following their formation (Lasker et al., 2003; Lartaud et al., 2012). Moreover, branches that produce side branches (generally classified as “Mother branches”) tended to grow faster than branches that do not ramify (“Daughter”), especially during the year preceding the formation of a new branch (Lasker et al., 2003).
As also observed by Prouty et al., (2014), Paramuricea sp. B3 at AT357 grew at least twice as fast as P. biscaya from any site. Species-specific factors may explain part of the differences observed between P. sp. B3 and P. biscaya. Differences in growth rates are also likely linked to the environment. Growth rates of P. biscaya were variable between sites, with the highest growth observed at MC294 and lowest at MC344. One result of differential growth rates is that colonies of P. sp. B3 were overall younger but larger than those of P. biscaya, and colonies at MC344 were the smallest and oldest (Prouty et al., 2014). Depth may be a significant environmental factor affecting growth rates; AT357 is the shallowest site (1050 m) followed by MC294 (1370 m), GC852 (1400 m), MC297 (1560 m) and MC344 (1850 m). Differences in deep-sea octocoral species richness (Quattrini et al., 2013), abundance (Mortensen and Buhl-Mortensen, 2004), size (Watanabe et al., 2009), and morphology (Quattrini et al., 2016) have been linked to depth. Previous studies have also found correlations between depth and growth rates of corals (Thresher, 2009). In shallow water, octocoral community composition and morphology follow environmental gradients of water quality, light intensity, and water movement (Kim et al., 2004; Gori et al., 2011; Rowley et al., 2015; Velásquez and Sánchez, 2015; Shoham and Benayahu, 2017). Although little is known about the effects of depth-related environmental gradients on deep-sea octocorals (Quattrini et al., 2015), differences in growth rates may be due to food limitation, as the quality and availability of surface-derived food tend to decrease with depth (Suess, 1980). Other site-specific variables may also explain differences in growth rates at these sites. Although current strength and direction were not measured in this study, currents appeared to be the weakest at MC344, the site where corals grew the least, and the strongest at GC852 based on ROV maneuverability and videos. Moreover, the majority of corals at the MC344 site grew on small boulders and were thus closer to the sediment and potentially more vulnerable to sediment smothering.
The initial level of impact, and more specifically the proportion of unhealthy branches documented in 2011, had a significant positive effect on the proportion of healthy branches that grew after 2014. Before 2014, this trend was negative but not significant. The presence of wounds on corals can reduce growth as energy is being re-allocated toward regeneration, which is especially costly in terms of energy when branches are colonized by hydroids (Yoshioka and Yoshioka, 1991; Meesters et al., 1994; Henry and Hart, 2005). Conversely, the higher growth rates observed for impacted corals after 2014 may reflect overcompensation. Faster growth rates after injury have been observed for several species, likely to re-establish body plan symmetry following the loss of branches (Castanaro and Lasker, 2003; Matsumoto, 2004; Henry and Hart, 2005). The fact that the current level of total visible impact did not have any significant effect on growth proportion supports this hypothesis. Branches that broke off after 2011 were not included in the calculation of the current level of total visible impact, and thus some colonies that were heavily impacted initially and lost a large number of branches appeared much healthier in the following years. Our results suggest that the remaining healthy branches on impacted colonies may grow at higher rates to compensate for branch loss.
Although there was no apparent long-term negative effect of the oil spill on coral growth at MC294 and MC297, none of the corals that were impacted over more than 20% of the colony at MC344 grew between 2011 and 2017. The slow growth rates of healthy corals and the old age of small colonies observed at this site suggest a lower resilience of MC344 corals to anthropogenic impact compared to the other sites. Recovery from the Deepwater Horizon oil spill was also the slowest at this site, and unlike at the other impacted sites, the health of most corals at MC344 tended to continue to deteriorate through 2017 (Girard and Fisher, 2018). Though not measured in this study, the lower resilience of MC344 corals could be due to food limitation or another site-specific variable such as current strength or substrate type.
Growth was not sufficient to compensate for the high branch loss experienced by corals at MC294, as shown by the significant decrease in coral size between 2011 and 2017. The size of octocorals has been shown to influence fecundity in corals. Corals generally reach sexual maturity after they get to a certain size, and large colonies tend to have a higher reproductive output than small colonies (Coma et al., 1995; Page and Lasker, 2012; Teixidó et al., 2016). Even though no data are available on the effect of the Deepwater Horizon oil spill on coral reproduction, the decrease in coral size at MC294 suggests that the fecundity of impacted corals might have been affected. In addition, a decrease in coral size could have an impact on the entire coral community, as coral size has been shown to correlate positively with the abundance of associated fauna (Buhl-Mortensen and Mortensen, 2005). Negative effects on fecundity and the abundance of associates are likely to persist for decades, as colonies at MC294 are expected, on average, to take over 50 years to grow back to their original size.
As for other octocoral species (Roark et al., 2009; Martinez-Dios et al., 2016), Paramuricea biscaya and Paramuricea sp. B3 were characterized by high longevity. Colony ages estimated from the growth rates measured at each site were similar to those reported by Prouty et al., (2014), who used radiocarbon dating on corals from the same sites (Figure 7). Paramuricea spp. colonies analyzed in our study were significantly older than Paramuricea sp. specimens from a depth of 800 m in the Northwest Atlantic, where the oldest colonies were about 200 years old (Sherwood and Edinger, 2009). The much larger dataset reported here contains many larger corals at each site and extends the longevity estimates from Prouty et al., (2014) for both species. While Prouty et al., (2014) estimated that the two specimens of P. sp B3 that they collected (with heights less than 25 cm) were about 60 years old, we found that some of the largest colonies at this site (between 50 and 75 cm in height) could be over 700 years old. The oldest P. biscaya colony measured by Prouty et al., (2014) was collected at MC344. It was about 25 cm in height and estimated to be 660 years old. Based on average growth rates determined from images, the larger colonies at MC344 are over 2000 years old (Figure 7). In fact, the two largest colonies analyzed at this site could be as old as, or even older than, the oldest coral reported to date (Leiopathes sp., 4265 years old; Roark et al., 2009). Importantly, ages presented in our study were estimated based on a constant growth rate throughout the life span of coral colonies, as our data did not show an effect of size at most sites. As octocorals generally demonstrate declining growth with age or size (Coma et al., 1998; Cordes et al., 2001; Lasker et al., 2003; Doughty et al., 2013), additional study will likely refine these estimates.
Because a small amount of growth may not have been detected when polyps were not visible, especially when branches were unhealthy, the growth of impacted corals may have been underestimated. Overall, growth measurements were more accurate when the 2012 and 2017 images were compared directly than when growth was measured between every consecutive year and then summed. Because growth rates were slow, new growth could be difficult to detect, especially when image quality was not optimal. Therefore, the longest time period possible should be used for growth measurements in order to optimize results.
Despite some uncertainties, the method we developed produced results that were consistent with other studies (Prouty et al., 2014) and that can be used without damaging or collecting old coral colonies. Because of their great longevity and vulnerability, the need to develop non-invasive methods for studying deep-sea corals is acute, as has been recognized by other investigators (Bennecke et al., 2016; Etnoyer et al., 2018). To our knowledge, our study is the first to measure successfully the annual growth rates of hundreds of deep-sea coral colonies of varying sizes using a non-invasive method.
In summary, the longevity, low growth rates, and low recruitment rates suggested for Paramuricea sp. B3 and Paramuricea biscaya, indicate that hundreds of years may be necessary for corals impacted by the Deepwater Horizon Spill to grow back to their original biomass, and highlight the low resilience of deep-sea corals to anthropogenic impact. The non-destructive method we developed to measure coral growth and age has two significant advantages over isotopic methods: it does not require the collection of entire colonies and much larger numbers of corals can reasonably be measured. In addition to estimating the potential longevity of a coral species, this method allows for the examination of temporal variation and within-colony patterns in growth, as well as comparison of in situ growth under different conditions.
The same images and analytical techniques used to monitor growth with these methods can simultaneously provide data on changing health and branch loss of the corals. This study and previous studies (Hsing et al., 2013; Girard and Fisher, 2018) demonstrate the utility of precisely acquired high-resolution images to study coral impact and recovery after a disturbance. Deep-sea corals are listed as Vulnerable Marine Ecosystem (VME) indicator taxa by the United Nations General Assembly (UNGA, 2009) and Food and Agricultural Organization (FAO, 2009). Adding image-based analysis of growth to the analyses of health and branch loss would greatly increase the power to detect non-acute impacts and changes in these indicator taxa in areas identified as VMEs using non-destructive methods (images). In addition, images can be analyzed for occurrence and abundance of other species associated with the corals (Girard et al., 2016), and thus provide other complementary indicators of change in the health of coral-containing VMEs. Similarly, this method could be used to evaluate the effectiveness of conservation measures in both Marine Protected Areas and potential deep-sea coral restoration projects.
Data Accessibility Statement
The high-resolution images of corals used in this study can be found on the Gulf of Mexico Research Initiative Information and Data Cooperative (GRIIDC) repository (https://data.gulfresearchinitiative.org). Images collected in 2011: <10.7266/N78913TC> (Fisher, 2016a); 2012: <10.7266/N7HQ3WVD> (Fisher, 2016b); 2013: <10.7266/N7D21VJQ> (Fisher, 2016c); 2014: <10.7266/N74J0C2M> (Baums and Fisher, 2016); 2015: <10.7266/N7CF9NH9> (Fisher, 2017).
Acknowledgments
We would like to thank the crews of the ships and deep submergence facilities involved in this study as data collection would not have been possible without their expertise. We also thank S. Vohsen, C. Du Preez, R. Dannenberg, J. Mentch, M. Kurmann, D. McKean, S. Berlet, S. Smith, A. Weinheimer, C. Bashaw, A. Yang, K. Anderson, and M. McGuigan for their assistance at sea and in the lab. We are particularly grateful to T. Boyer, T. McElroy, L. Bullock, G. DiNicola and T. Albertson for their invaluable help with growth measurements. This research was made possible by a grant from the Gulf of Mexico Research Initiative. Data, including all photographs of all individual corals from all sites, are publicly available through the Gulf of Mexico Research Initiative Information and Data Cooperative (GRIIDC) at https://data.gulfresearchinitiative.org (doi: <10.7266/N78913TC>, <10.7266/N7HQ3WVD>, <10.7266/N7D21VJQ>, <10.7266/N74J0C2M>, <10.7266/N7CF9NH9>). This is contribution no. 520 from the Ecosystem Impacts of Oil and Gas Inputs to the Gulf (ECOGIG) consortium.
Funding information
This study was funded by a grant from the Gulf of Mexico Research Initiative awarded to the Ecosystem Impacts of Oil and Gas Inputs to the Gulf (ECOGIG) consortium. Some of the data collected in 2011 were funded by NOAA and BP as part of the Deepwater Horizon oil spill Natural Resource Damage Assessment (NRDA). The funding sources had no role in data collection, the preparation of the manuscript or decision to publish.
Competing interests
The authors have no competing interests to declare.
Author contributions
Contributed to conception and design: FG, CRF
Contributed to acquisition of data: FG, CRF
Contributed to analysis and interpretation of data: FG, RC, OG, TH, CRF
Drafted and/or revised the article: FG, RC, OG, TH, CRF
Approved the submitted version for publication: FG, RC, OG, TH, CRF